Why Your Top Revenue Product May Be Killing Your Profits
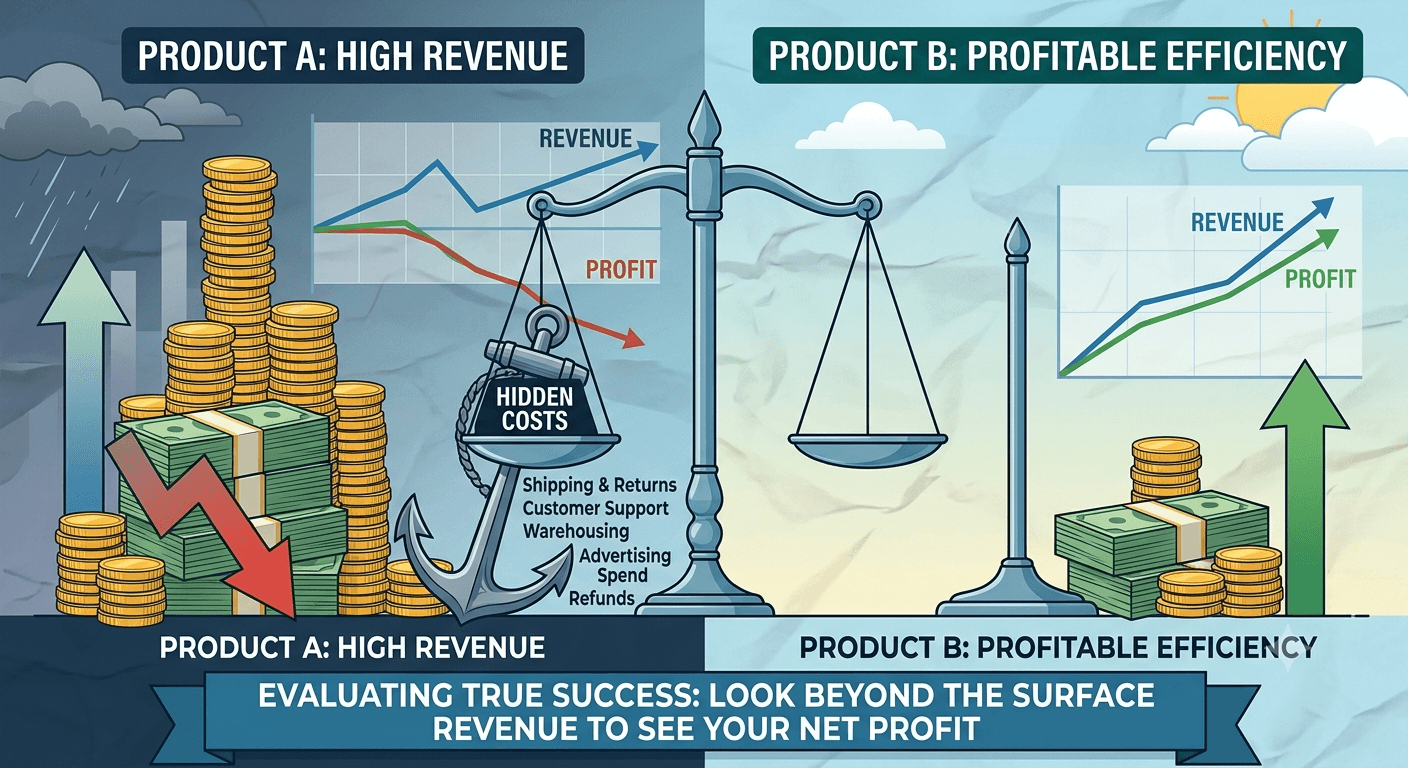
The Revenue Mirage: When Success Masks Failure
Picture this: Your highest-revenue product generates £500,000 annually and represents 40% of your business. The gross margin looks healthy at 60%. Your dashboard shows green across the board. Yet, this "star performer" is quietly hemorrhaging £200,000 in net losses every year.
This isn't a hypothetical scenario—it's a reality we've uncovered in 73% of the e-commerce brands we analyze at CortexCart. The problem? Most businesses evaluate product success using dangerously incomplete metrics.
Why Traditional Metrics Miss the Mark
Standard revenue reporting focuses on:
- Gross revenue figures
- Basic gross margins (revenue minus cost of goods sold)
- Top-line growth percentages
What gets ignored are the hidden costs that accumulate like an iceberg beneath the surface—customer acquisition costs, return processing, support overhead, inventory carrying costs, and opportunity costs of capital allocation.
The Unit Economics Reality Check
True product profitability requires a complete unit economics analysis. Here's the framework that reveals the real story:
Complete Unit Economics Formula
Net Unit Profit = Revenue per Unit - (COGS + CAC + Support Cost + Return Cost + Inventory Carrying Cost + Opportunity Cost)
Let's break down each component:
- COGS: Direct manufacturing and fulfillment costs
- CAC (Customer Acquisition Cost): Marketing spend divided by customers acquired
- Support Cost: Customer service time allocated per product
- Return Cost: Processing, restocking, and lost inventory from returns
- Inventory Carrying Cost: Storage, insurance, and capital tied up in stock
- Opportunity Cost: What else could that capital and effort have generated?
Red Flags: 8 Warning Signs Your High-Revenue Product Is Unprofitable
Our analysis of 200+ e-commerce brands has identified these critical warning indicators:
Immediate Red Flags
- High return rates (>15%): Indicates product-market fit issues
- Disproportionate support tickets: Complex products drain resources
- Long inventory cycles (>90 days): Capital efficiency problems
- High CAC relative to competition: Market saturation or poor targeting
Strategic Red Flags
- Declining repeat purchase rates: One-time buyers indicate satisfaction issues
- Price pressure from competitors: Margin erosion over time
- High inventory write-offs: Demand forecasting problems
- Negative customer lifetime value trends: Long-term sustainability issues
Case Study: The £500K Revenue Trap
A fashion e-commerce client came to us celebrating their "hero product"—a premium jacket line generating £500,000 annually. Here's what our deep-dive analysis revealed:
Surface-Level Metrics (What They Saw)
- Annual Revenue: £500,000
- Gross Margin: 60% (£300,000)
- Units Sold: 2,500
- Average Order Value: £200
Hidden Costs Analysis (What We Found)
- CAC: £80 per customer (premium market, high competition)
- Return Rate: 22% (sizing and quality issues)
- Return Processing: £35 per return (£19,250 total)
- Support Overhead: 45% of tickets (£28,000 in staff time)
- Inventory Carrying: £67,000 (seasonal product, long cycles)
- Opportunity Cost: £85,000 (capital could generate 12% elsewhere)
The Shocking Reality
Net Loss: £199,250 annually
This "star product" was actually their biggest profit drain, masked by impressive top-line numbers.
The Product Profitability Matrix
We use a four-quadrant framework to evaluate product portfolios:
Quadrant 1: Cash Cows (High Revenue, High Profit)
Action: Scale and optimize. These are your true winners.
Quadrant 2: Hidden Gems (Low Revenue, High Profit)
Action: Increase marketing investment and inventory allocation.
Quadrant 3: Revenue Traps (High Revenue, Low/Negative Profit)
Action: Urgent optimization or discontinuation required.
Quadrant 4: Clear Losers (Low Revenue, Low Profit)
Action: Immediate discontinuation and capital reallocation.
Implementation Roadmap: Week-by-Week Action Plan
Week 1-2: Data Collection
- Gather complete cost data for each product line
- Calculate true CAC by product (not blended)
- Analyze return rates and processing costs
- Quantify support time allocation
Week 3-4: Analysis and Classification
- Apply the unit economics formula to each product
- Plot products in the profitability matrix
- Identify optimization opportunities vs. discontinuation candidates
- Calculate opportunity costs of capital reallocation
Week 5-6: Strategic Decision Making
- Prioritize quick wins (pricing adjustments, supplier negotiations)
- Plan medium-term optimizations (product improvements, process efficiency)
- Make difficult discontinuation decisions
- Develop capital reallocation strategy
Week 7-8: Implementation and Monitoring
- Execute immediate changes
- Set up ongoing monitoring systems
- Establish regular review cadence
- Train team on new evaluation criteria
The Human-in-the-Loop Advantage
While AI can process vast amounts of data to identify these hidden patterns, human insight is crucial for interpreting context and making strategic decisions. At CortexCart, our approach combines:
- AI Precision: Automated detection of profitability anomalies across thousands of SKUs
- Human Expertise: Strategic interpretation of market context and competitive dynamics
- Actionable Intelligence: Clear, prioritized recommendations based on your specific business goals
Beyond Product-Level: Portfolio Optimization
True profitability optimization extends beyond individual products to portfolio-level decisions:
Cross-Selling Synergies
A low-margin product might be justified if it drives high-margin add-on sales. Our analysis includes customer journey mapping to identify these relationships.
Seasonal Balancing
Products with different seasonal patterns can optimize inventory turnover and cash flow cycles when managed as a portfolio.
Market Positioning
Some products serve strategic purposes (market entry, competitive blocking) that justify temporary negative margins for long-term positioning.
Next Steps: Don't Let Revenue Fool You
If you're evaluating product success based solely on revenue figures, you're likely making costly strategic mistakes. The brands that thrive long-term are those that understand the difference between revenue generation and profit creation.
Start with our free product profitability assessment toolkit to identify which of your products might be secretly draining profits while appearing successful on the surface.
Remember: In business, what you don't measure accurately, you can't optimize effectively. And what you can't optimize, will eventually optimize your business—right out of existence.
Ready to uncover the real profit drivers in your product portfolio? Our AI-powered analytics platform, combined with expert human insight, can reveal the hidden patterns that traditional reporting misses. Schedule a consultation to see exactly where your profits are hiding.